Demo for how to fit a single period of biastable bias for further removal#
import matplotlib.pyplot as plt
import numpy as np
from functools import partial
from scipy.optimize import curve_fit

from sl2pm.bistable_bias import bb_single
Matplotlib is building the font cache; this may take a moment.
Load single period (averaged) of bistable bias from one PMT (GaAsP)
t, y = np.load('pmt_bistable_bias.npy')
bb_period = 0.00331 # period of the bistable bias  in sec
Intitial parameter values for the fit
p0 = dict(t0=0.00072804,
            w=0.00052,
            tau1=5e-5,
            tau2=2.1e-5,
            dI1=5.8,
            dI2=13.5,
            I0=176.7)
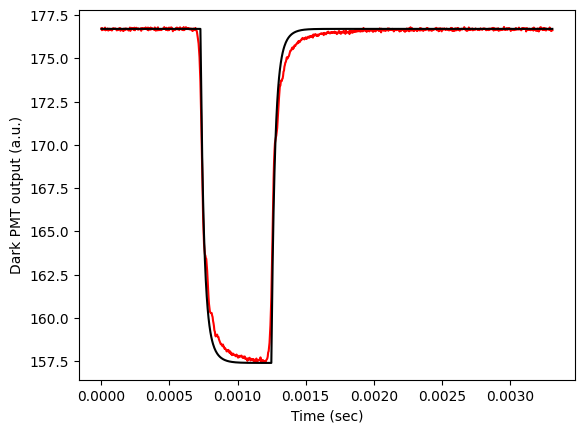
Plot data (red) and its expected value (black), evaluated with the initial parameter guess
plt.plot(t, y, c='r')

plt.plot(t, bb_single(t, *p0.values(), dt=bb_period), c='k')

plt.ylabel('Dark PMT output (a.u.)')
plt.xlabel('Time (sec)')
Text(0.5, 0, 'Time (sec)')
Fit single period of bistable bias
popt, pcov = curve_fit(partial(bb_single, dt=bb_period), t, y, list(p0.values()))
/home/docs/checkouts/readthedocs.org/user_builds/sl2pm/envs/latest/lib/python3.11/site-packages/sl2pm/bistable_bias.py:8: RuntimeWarning: overflow encountered in exp
  return np.where(t>=0, dI1*(1 - np.exp(-t/tau1)) + dI2*(1 - np.exp(-t/tau2)), np.zeros(shape=t.shape))
/home/docs/checkouts/readthedocs.org/user_builds/sl2pm/envs/latest/lib/python3.11/site-packages/sl2pm/bistable_bias.py:8: RuntimeWarning: overflow encountered in multiply
  return np.where(t>=0, dI1*(1 - np.exp(-t/tau1)) + dI2*(1 - np.exp(-t/tau2)), np.zeros(shape=t.shape))
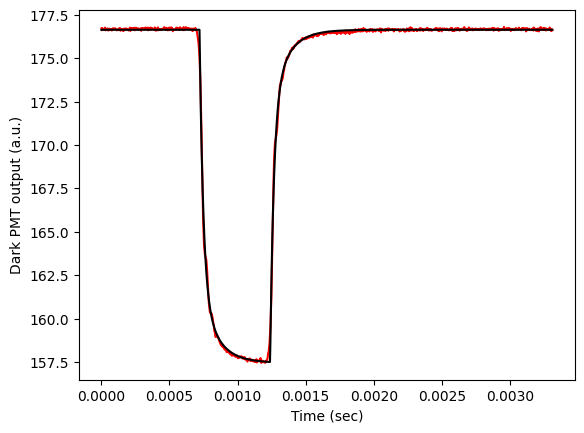
Plot data (red) and its fitted expected value (black)
plt.plot(t, y, c='r')

plt.plot(t, bb_single(t, *popt, dt=bb_period), c='k')

plt.ylabel('Dark PMT output (a.u.)')
plt.xlabel('Time (sec)')
Text(0.5, 0, 'Time (sec)')
List fitted parameters
for name, val in zip(p0.keys(), popt):
    print(f'{name} = {val:.6f}')
t0 = 0.000721
w = 0.000518
tau1 = 0.000114
tau2 = 0.000027
dI1 = 4.592008
dI2 = 14.611316
I0 = 176.649415